How to Monitor CPU Temperature and Status of Raspberry Pi
Companies managing large fleets of distributed IoT devices must contend with a torrent of telemetry data from individual devices, which are often globally dispersed and built on multiple software and hardware platforms. To reliably operate their IoT fleets, companies need a comprehensive view of the health of their devices in aggregate, as well as system error log to troubleshoot and diagnose device hardware and application problems.
RemoteIoT provides insight on CPU, memory and disk utilization for IoT devices. Companies can monitor IoT system performance, device hardware metrics, CPU Temperature, system error logs, network performance data, and more, all in one single dashboard.
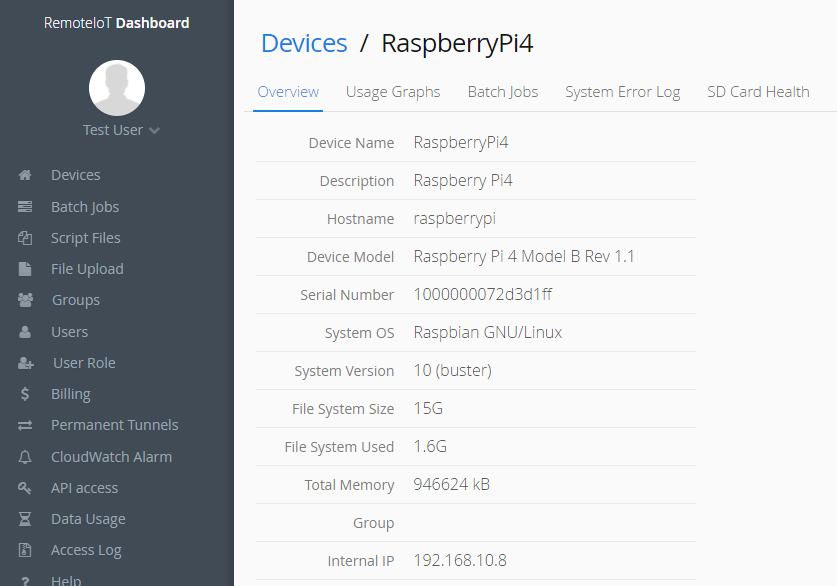
After install the service in your Raspberry Pi, open the RemoteIoT portal and click one device, the page shows the overview information of the device, such as hostname, device model, serial number and operating system.

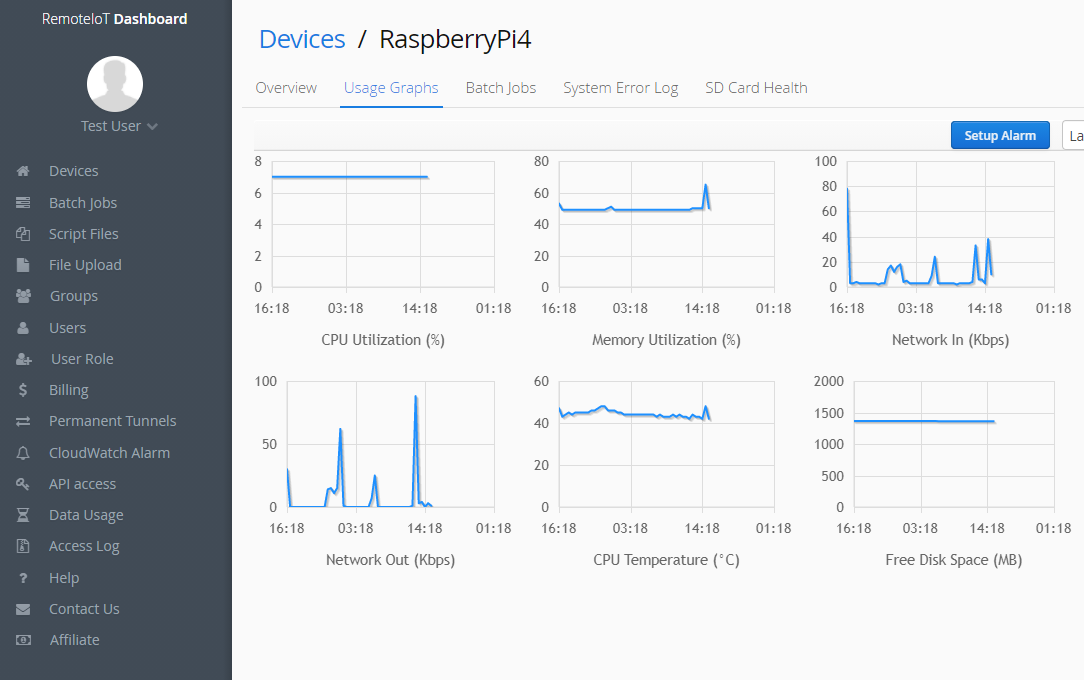
On the 'Usage Graphs' tab, you can view the system health status of the Raspberry Pi in these graphs. Available graphs are:
- CPU Utilization
- Memory Utilization
- Network In
- Network Out
- CPU Temperature
- Free Disk Space

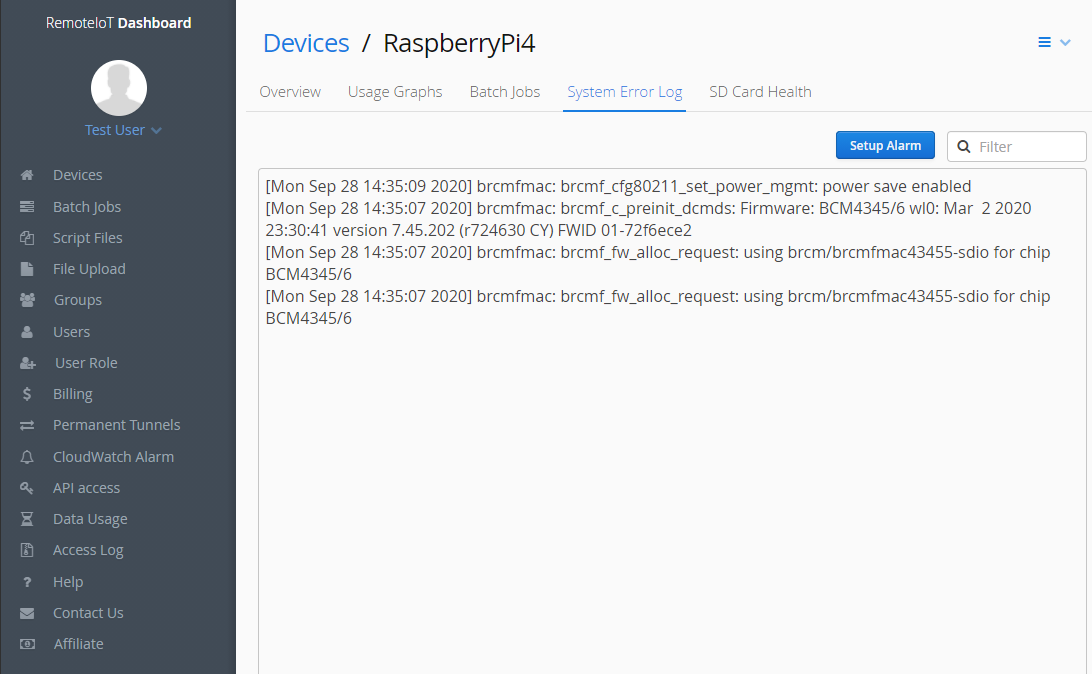
On the 'System Error Log' tab, you can view these system kernel messages to troubleshoot and diagnose device hardware problems, such as hard disk errors or USB problems.

